NCERT QUESTIONS AND ANSWERS
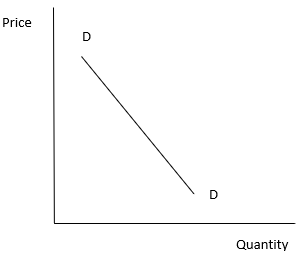
1.What would be the shape of the demand curve so that the total revenue curve is
(a) a positively sloped straight line passing through the origin?
Ans. If the total revenue curve is a positively sloped straight line passing through the origin, then the slope of demand curve will be horizontal line parallel to X axis. It indicates that the price remains constant at all level of output.

(b) a horizontal line?
Ans If the total revenue curve is a horizontal line, then the demand curve will be downward sloping. The firms can increase their volume by decreasing price due to which average revenue will fall with increase in sales.
2.From the schedule provided below calculate the total revenue, demand curve
and the price elasticity of demand:
Ans

3.What is the value of the MR when the demand curve is elastic?
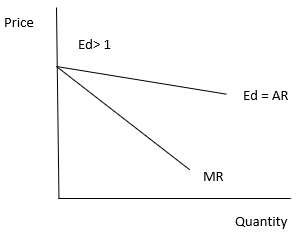
Ans The relationship between MR and elasticity of demand is given by –MR = P (1 – 1/Ed)
When demand curve is elastic, i.e. Ed > 1, the MR will be positive because for any value of Ed, 1/Ed will be less than 1.
The graph representing it is given below –
4.A monopoly firm has a total fixed cost of Rs 100 and has the following
demand schedule:
Find the short run equilibrium quantity, price and total profit. What would be the equilibrium in the long run? In case the total cost was Rs 1000, describe the equilibrium in the short run and in the long run
Ans

The total cost of monopolist firm is zero, so the profit will be the maximum where TR is maximum.
At the 6th unit of output the firm will maximise its profit and the short run equilibrium price will be Rs 50.
Profit = TR – TC
= 300 – 0= Rs 300
If the total cost is Rs 1000, then
Profit = TR – TC
= 300 – 1000= – Rs 700
In this case the firm is earning loss and not profit. So, it will stop its production in the long run.
- If the monopolist firm of Exercise 3, was a public sector firm. The government set a rule for its manager to accept the government fixed price as given (i.e. to be a price taker and therefore behave as a firm in a perfectly competitive market), and the government decide to set the price so that demand and supply in the market are equal. What would be the equilibrium price, quantity and profit in this case?
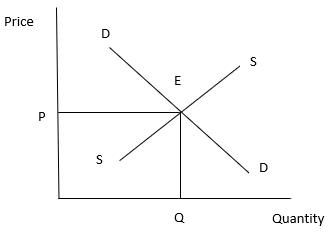
Ans. If the government sets a rule for the public sector firm to accept the fixed price then the monopoly firm will start behaving like a perfectly competitive firm and will become price taker. In such case the firm will earn only normal and no economic profit.
Given below is the graphic presentation of demand and supply at the equilibrium price P(fixed by government) and quantity Q
6.Comment on the shape of the MR curve in case the TR curve is a
(i) positively sloped straight line,
(ii) horizontal straight line.
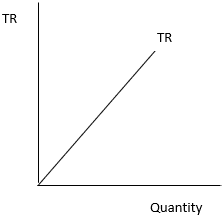
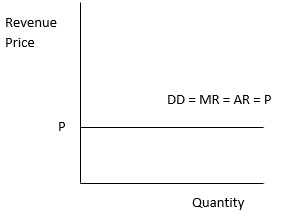
Ans. i. When TR curve is a positively sloped straight line then MR curve is a horizontal line. Under perfect competition MR curve and demand curve are same and the average revenue remains constant and equals to the price for different levels of output due to which MR is constant and TR increases at increasing rate so the TR curve is positively sloped straight line.
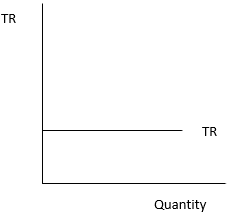
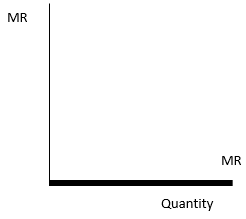
- When TR curve is a horizontal straight line, then MR is zero because the units sold is same at every level of output and Marginal Revenue is the additional revenue generated from the sale of an additional unit of output. Therefore, MR curve is also a horizontal straight line and coincides with the output-axis.
7.The market demand curve for a commodity and the total cost for a monopoly firm producing the commodity is given by the schedules below. Use the information to calculate the following:
- The MR and MC schedules
Ans The MR and MC schedules

- The quantities for which the MR and MC are equal
Ans The quantities for which the MR and MC are equal
MR =MC = 6 units of Quantity, where both MR and MC is Rs 4
(c) The equilibrium quantity of output and the equilibrium price of the Commodity
Ans. The equilibrium quantity of output and the equilibrium price of the commodity
Equilibrium Price = Rs 19; Equilibrium Quantity = 6
(d) The total revenue, total cost and total profit in equilibrium.
Ans. TR = Rs 114; TC = Rs 109; Profit = Rs 5 (TR – TC)
8.Will the monopolist firm continue to produce in the short run if a loss is incurred at the best short run level of output?
Ans. A monopolist firm can earn losses in the short run if the price is less than the minimum of AC. But if the price falls below the minimum of AVC, then the monopolist will stop production.
In short run the firm tries to recover at least the minimum of AVC, so the firm will continue to produce when the price is between the minimum of AVC and the minimum of AC.
9.Explain why the demand curve facing a firm under monopolistic competition is negatively sloped.
Ans. A monopolistic firm has differentiated products so if its wants to increase its sale it will have to lower the prices.
The products of different monopolistic firms are close substitutes to each other so the demand is elastic. High availability of close substitutes make the demand curve negatively sloped of a firm under monopolistic competition market
10.What is the reason for the long run equilibrium of a firm in monopolistic competition to be associated with zero profit?
Ans. In a monopolistic competition, there are large number of firms and free entry and exit of firms in the market is permitted.
In the short run, a firm may earn abnormal profit which attracts new firms, it will expand the output of the commodity which will result in fall in the market price of that commodity. Thus with the entry of firms the output will expand and the prices will fall and it will continue till the profit becomes zero. At this level of profit there will be no attraction for new firms to enter the market.
On the contrary, if the firms are facing losses in short run some firms will stop producing the commodity and leave the market due to which there will be contraction of output which will increase the price and the price will continue to rise until it becomes equal to the minimum of AC. ‘Price = AC’ implies that in the long run all the firms will earn zero economic profit.
Hence, when the price is equal to the minimum of AC, neither any existing firm will leave nor any new firm will enter the market.
11.List the three different ways in which oligopoly firms may behave.
Ans. Oligopoly firms may behave in the following three ways:
- i) Cartel – In order to avoid undue competition, oligopolistic firms may engage in formal agreements or contracts. With help of forming cartels the firms will not only maximise their total profits together, but also capture a significant market portion.
- ii) Barriers to the entry of new firms – It may happen that existing firms try to adopt entry preventing price, which restricts the entry of new firms into oligopoly market. Every producer believes in sales maximisation policy instead of profit maximisation while determining prices.
iii) Advertisement and differentiated product – It may happen that the firms realise that price competition will leave them nowhere and consequently they emphasise more on advertising their products and making their products unique from that of the competitors’. It will enable them to capture the minds of consumers and indirectly increase their market portion.
12.If duopoly behaviour is one that is described by Cournot, the market demand curve is given by the equation q = 200 – 4p, and both the firms have zero costs, find the quantity supplied by each firm in equilibrium and the equilibrium
market price.
Ans. Given – Market demand curve
Q = 200 – 4p
When the demand curve is a straight line and total cost is zero, the duopolistic finds it most profitable to supply half of the maximum demand of a good.
At P = Rs 0, market demand is Q = 200 – 4 (0) = 200 units
If firm B does not produce anything, then the market demand faced by firm A is 200 units. Therefore, The supply of firm A = 100 units
In the next round, the portion of market demand faced by firm B is =200 – 100 = 100 units. Therefore, Firm B would supply = 50 units
Thus, firm B has changed its supply from zero to 50 units. To this firm A would react accordingly and the demand faced by firm A will be
= 200 – 50 = 150 units
Therefore, Firm A would supply = =75 units.
The quantity supplied by firm A and firm B is represented in the table below –

Therefore, the equilibrium output supplied by firm A = 200/3 units = the equilibrium output supplied by firm B
Market Supply = 200/3 + 200/3 = 400/3 units
For equilibrium price
q = 200 – 4p
4p = 200 – q
P = 50 – q/4
P = 50 – (400/3) /4
P = 50 – 400/12 = 16.67
- What is meant by prices being rigid? How can oligopoly behaviour lead to such an outcome?
Ans. Price rigidity refers to a situation in which whether there is change in demand and/or supply the price will be fixed, it will not change.
In an oligopolistic market firms are in a position to influence the prices.
However the firm’s stick to their prices to avoid price war, but if a firm try to reduce the price the others will also react in the same manner so there will be no benefit.
In the same manner if a firm tries to raise the price, the other firms will not do so as a result of which, the firm which has intended to increase the price will lose its customers.
So oligopoly behaviour leads to price rigidity in an oligopolistic market


