
NCERT QUESTIONS AND ANSWERS
1.What are the characteristics of a perfectly competitive market?
Ans A perfectly competitive market is that type of market in which there are large number of buyers and sellers engaged in buying and selling homogeneous product without any restriction on entry in and exit from the market.
The characteristics of search market are –
- a) Large number of buyers and sellers – The buyers and sellers are so large that a single buyer or seller could not influence the market price. A single purchaser or seller is just like a drop of water in an ocean.
- b) Homogeneous product – It means all the forms are engaged in selling homogeneous product that is a products which are identical to each other or are standardised or say which can be substituted with each other so the buyer is not at all ready to pay any extra amount for the product who’s close substitute is available.
- c) Free entry and exit – The firms are free to enter into the market and to leave the market. The firms who have the chances to earn more profit enter the market and the one who suffers loss leaves the market.
- d) Perfect knowledge – The buyers and sellers must possess complete knowledge about the prices at which goods are being bought and sold and also the price at which others are prepared to buy and sell.
- e) Transportation Cost – The transport cost is either Zero OR negligible.
f) Perfect mobility of factors of production –The factors of production are perfectly mobile between the industries. In perfectly competitive market the sellers are price taker not the price making. However perfect competition is purely a myth, this type of market do not exist.
2.How are the total revenue of a firm, market price, and the quantity sold by thefirm related to each other?
Ans. Total revenue is defined as the total sale proceeds of a producer by selling corresponding level of output therefore total revenue can be defined as the total sales proceed of the seller by selling the number of units at a given price.
In a perfectly competitive market the firm is a price taker so it can’t influence the price hence it can change its total revenue by changing the quantity of output sold.
TR = P X Q
Where, TR – Total Revenue
Q – Quantity of Output sold
P – Price
The total revenue curve is give below –
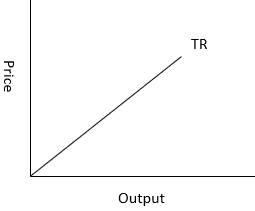
It touches the X-axis because the TR is zero if zero output is sold
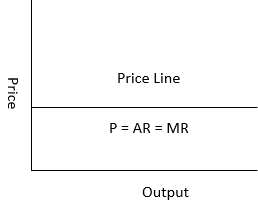
3.What is the ‘price line’?
Ans. Priceline is the graphical representation of the relationship between the quantity of output sold and its price. It is a horizontal straight line in case of perfectly competitive market where price is equal to average revenue and marginal revenue.
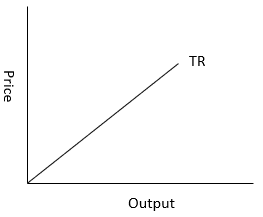
4.Why is the total revenue curve of a price-taking firm an upward-sloping straightline? Why does the curve pass through the origin?
Ans. Total revenue is defined as the total sale proceeds of a producer by selling corresponding level of output therefore total revenue can be defined as the total sales proceed of the seller by selling the number of units at a given price.
In a perfectly competitive market the firm is a price taker so it can’t influence the price hence it can change its total revenue by changing the quantity of output sold.
The total revenue curve of a price taking firm is upward sloping straight line because in perfectly competitive market the firm is a price taker and so the price or average revenue is constant. Due to this the total revenue increases proportionately with increase in the quantity of output sold. Total revenue curve passes through origin because if quantity of output sold is zero then total revenue will also be zero.
5.What is the relation between market price and average revenue of aprice takingfirm?
Ans. In case of a price taking firm, the average revenue is equal to price. Average revenue (AR) can be defined as total revenue divided by the quantity sold.
Therefore, average revenue may be defined as revenue per unit of output sold.
AR = TR / Q
Where, TR – Total Revenue = P X Q
AR – Average Revenue
Q – Quantity of Output Sold
AR = (P X Q)/Q = P
With help of following table we can understand this

6.What is the relation between market price and marginal revenue of a pricetaking firm?
Ans. Marginal revenue is the change in revenue with every additional quantity of output sold. It can be calculated with help of following formula
MR = TRn+1 - TRn
Where,
MR – Marginal Revenue
TRn+1 - Total revenue on sale of (n+1) quantity of output
TRn - Total revenue on sale of (n) quantity of output
In case of a price taking firm the market price is equal to marginal revenue. Therefore, in perfectly competitive market –
P = AR= MR
With help of following table we can understand this

7.What conditions must hold if a profit-maximising firm produces positive outputin a competitive market?
Ans. The following three conditions must be satisfied if a profit maximizing firm produces positive level of output in a competitive market –
- a) The marginal cost should be equal to marginal revenue (MC = MR). It will be called equilibrium output level.
- b) The marginal cost should be more than marginal revenue (MC > MR) after equilibrium output level.
- c) In short run the prices must be greater than or equal to average variable cost (P ≥ AVC) where as in long run the prices must be greater than or equal to average cost (P ≥ LAC) at equilibrium output level.
8.Can there be a positive level of output that a profit-maximising firm producesin a competitive market at which market price is not equal to marginal cost?Give an explanation.
Ans. There cannot be a positive level of output for profit maximizing firm when average revenue is not equal to marginal cost because the output will be produced at equilibrium, where marginal revenue is equal to marginal cost.
In case of a perfectly competitive market AR equals to MR and as AR is not equal to MC so MR will not be equal to MC. Hence there is no equilibrium and there cannot be any positive level of output.
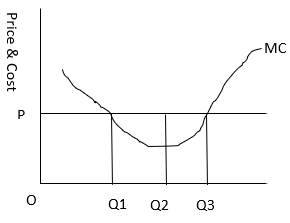
We can understand this with help of following graph –
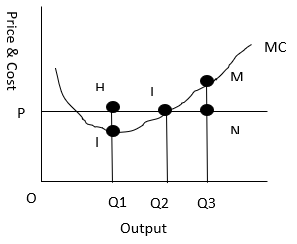
- If price is more than marginal cost (P > MC, Point H)
In given graph at output OQ1, the price is HQ1, which is more than the marginal cost is lQ1. As we can see that OQ1 is not profit-maximizing output because the firm can increase its profit level by expanding its output to OQ2, where price and marginal cost are L i.e P = MC
- If price is less than marginal cost (P < MC, Point M)
In the given graph when OQ3 quantity is sold at the prices NQ3 the marginal cost is MQ3. Here we can see that even at OQ3 the firm is not maximizing the profit because the profit can be maximized at OQ2.
So, there cannot be a positive level of output for profit maximizing firm when average revenue is not equal to marginal cost
9.Will a profit-maximising firm in a competitive market ever produce a positivelevel of output in the range where the marginal cost is falling? Give anexplanation.
Ans. A profit maximizing competitive firm will continue to produce in the range when marginal cost is falling till the marginal revenue is more than marginal cost. So long as the profit tends to increase and equilibrium output is not reached, it will be reached when marginal cost is equal to marginal revenue.
Therefore, a profit maximizing firm can produce a positive level of output in the range a marginal cost is falling. However, it will produce positive output as long as marginal cost becomes equal to marginal revenue that is up to the equilibrium point.
10.Will a profit-maximising firm in a competitive market produce a positive level ofoutput in the short run if the market price is less than the minimum of AVC?Give an explanation.
Ans. No a profit maximizing firm will not produce at a level of output in short run when market price is less than minimum average cost because equality between market price and minimum average cost indicate the shutdown point. So a firm will never operate at a price less than minimum average cost.
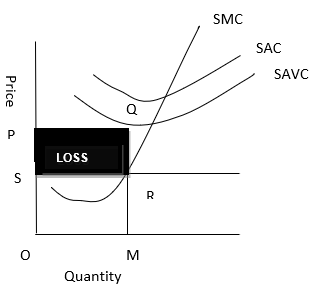
In the given graph –
At Price S, and Quantity M
TR = OS X OM, which is represented by the OMRS
TC = SAVC X OM = OP X OM, which is represented by the OMQP
Profit = TR – TC = OMRS – OMQP
As we can see
TC > TR, so there is loss, which is represented by PQRS
Thus the firm shall stop production whenever Price/AR < SAVC
In short run, at profit maximising level, AC ≥ SAVC
11.Will a profit-maximising firm in a competitive market produce a positive level ofoutput in the long run if the market price is less than the minimum of AC?Give an explanation.
Ans. No, it is not possible for a firm to produce positive level of output in long run if the market price is less than average cost because in long then there is free entry and exit of firms which leads to generate normal profit as their earning so if any firm is making loss in long run it will exit and stop production
12.What is the supply curve of a firm in theshort run?
Ans. In short run the supply curve of perfect competitive firm is the summation of the upward sloping portion of short run marginal cost when price is more than or equal to the minimum average variable cost and vertical portion of price axis when price is less than minimum average variable cost.
When price is more than or equal to average variable cost at market price
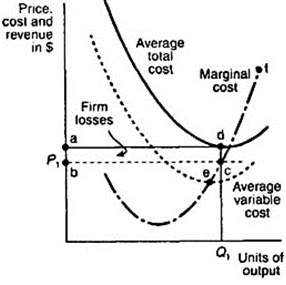
At market price P1 the 3 conditions for equilibrium are being fulfilled
- MC equals to MR at d
- MC is upward sloping
- Price exceeds the minimum of average variable cost
At this price the firm is producing profit-maximizing output Q1, here the supply curve is regarded as upward sloping part of marginal cost.
When the price is less than the minimum of average variable cost
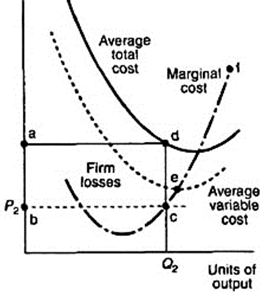
At price P2 which is lesser than the minimum average variable cost, at this price, the firm cannot produce as it cannot even cover its variable cost and so it will incur losses, which means that the form would produce nothing. Thus the firm will not produce anything at this price and thereby the quantity supplied will be zero the firm’s supply curve is indicated on price axis.
13.What is the supply curve of a firm in the long run?
Ans. In the long run as there is no fixed cost so the perfectly competitive firm supply curve will be the summation of upward sloping portion of marginal cost above the minimum point of average cost (when price is more than or equal to minimum of average cost ) and the vertical portion of the price axis (when price is less than minimum of average cost).
When price is more than or equal to the minimum of average cost
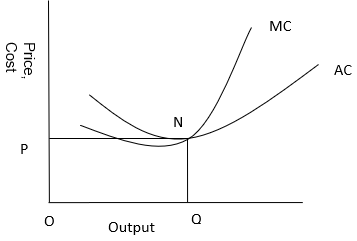
At market price OP which is more than average cost, MC is equal to MR at point N. MC is positively sloped at this point of intersection. The price is greater than minimum average cost so the firm is at long run equilibrium producing a few units of output supply curve is represented by the upper portion of marginal cost curve above minimum of average cost.
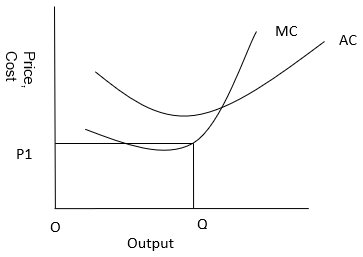
When price is less than minimum of average cost
Now suppose the market price faced by the form is OP1 which is less than minimum average cost. At this price the firm would not produce any output because producing any output will result in loss. Therefore the firm will not produce anything the supply curve in long run for price less than minimum of average cost is represented by vertical part of the price axis.
14.How does technological progress affect the supply curve of a firm?
Ans. Technological progress results in cost saving and increases supply so it is a positive function.
If the technology available to the firm will appreciate, the firm will be able to produce more units of output with the given level of input which will reduce the cost and the marginal cost curve will shift downward to the right which will also shift the supply curve towards right.
Thus with technological advancement the firm will supply more output at the given market price.
15.How does the imposition of a unit tax affect the supply curve of a firm?
Ans. The unit tax is a tax imposed on per unit of the output sold. Due to imposition of unit tax, the cost of production per unit of output increases which increases the marginal cost due to which the supply falls and the supply curve shift towards left.
Let us understand it with help of the following graph
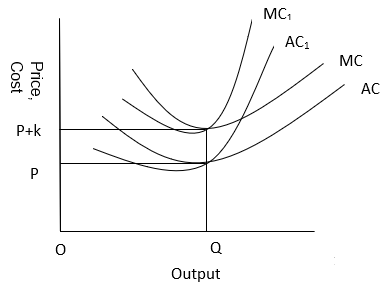
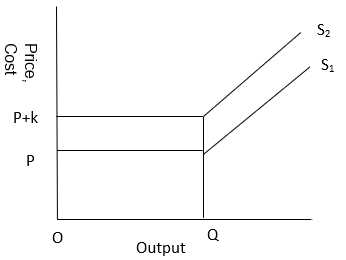
At given price P and Quantity Q and the average cost curve and marginal cost curve is given. Now suppose government imposes unit tax of rupees ‘k’ per unit so now the price will be ‘P + k’ due to which marginal cost curve and average cost curve will shift from AC1 to AC2 and marginal cost curve from MC1 to MC2. The magnitude of shift will be equal to k. As the supply curve is a part of marginal cost so it will also shift towards left from S1 to S2, therefore now the firm will supply lesser units of output
16.How does an increase in the price of an input affect the supply curve of a firm?
Ans. The increase in number of firms will shift market supply curve towards right.
Increase in price of input will increase the cost of production and the marginal cost of the firm. So the marginal cost curve will shift upward to the left and supply curve will also shift upward to do the left.
Therefore increase in output price will negatively affect the supply of the firm.
17.How does an increase in the number of firms in a market affect the marketsupply curve?
Ans. Increase in the number of firms in market will shift the market supply curve to the right. The market supply curve is the summation of all the supply curve of individual firms in the market. So, if the number of firms in market will increase the market supply curve will shift towards right as the amount of output will increase.
18.What does the price elasticity of supply mean? How do we measure it?
Ans. Price elasticity of supply is defined as the degree of responsiveness of quantity supplied to the change in price of a good. We can also define it as the percentage change in quantity supplied due to the percentage change in the price of that commodity.
![]()
Where,
Es = Price elasticity of supply
Proportionate Change in Price ![]()
Proportionate Change in Quantity Supplied ![]()
19.Compute the total revenue, marginalrevenue and average revenue schedulesin the following table. Market price of each unit of the good is Rs 10.
Ans.

20.The following table shows thetotal revenue and total costschedules of a competitive firm. Calculate the profit at each output level. Determine also the market price of the good.
Ans.

21.The following table shows the total cost scheduleof a competitive firm. It is given that the priceof the good is Rs 10. Calculate the profit at each output level. Find the profit maximising level of output.
Ans.

The profit maximising level of output is 5 units, where profit is maximum of Rs 12.
22.Consider a market with twofirms. The following tableshows the supply schedules of the two firms: the SS1 column gives the supply schedule of firm 1 and the SS2 column gives the supply schedule of firm 2. Compute the market supply schedule.
Ans.

23.Consider a market with twofirms. In the following table,columns labelled as SS1 and SS2 give the supply schedules of firm 1 and firm 2 respectively. Compute the market supply schedule.
Ans.

24.There are three identical firms in a market. Thefollowing table shows the supply schedule of firm
- Compute the market supply schedule.
Ans.

25.A firm earns a revenue of Rs 50 when the market price of a good is Rs 10. Themarket price increases to Rs 15 and the firm now earns a revenue of Rs 150.What is the price elasticity of the firm’s supply curve?
Ans.
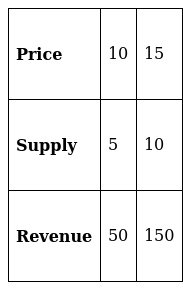
Supply = Revenue / Price
Change in quantity = 5
Change in price = 5
Proportionate change in Price = 5/10 = 0.5
Proportionate change in Quantity Supplied = 5/5 = 1
![]()
![]()
= 2
Proportionate Change in Quantity Supplied = 0.5 X 3 = 1.5
Proportionate change in Quantity Supplied = 15/x = 1.5
x = 15 / 1.5 = 10
Supply at base price of Rs 5 = 10
Change in quantity = 15
Therefore, new supply at the price of 20 will be = 10 + 15 = 25
26.The market price of a good changes from Rs 5 to Rs 20. As a result, the quantitysupplied by a firm increases by 15 units. The price elasticity of the firm’s supplycurve is 0.5. Find the initial and final output levels of the firm.
Ans. Given Es = 0.5

Change in quantity = 15
Change in price = 15
Proportionate change in Price = 15/5 = 3
![]()
![]()
Proportionate Change in Quantity Supplied = 0.5 X 3 = 1.5
Proportionate change in Quantity Supplied = 15/x = 1.5
x = 15 / 1.5 = 10
Supply at base price of Rs 5 = 10
Change in quantity = 15
Therefore, new supply at the price of 20 will be = 10 + 15 = 25
27.At the market price of Rs 10, a firm supplies 4 units of output. The market priceincreases to Rs 30. The price elasticity of the firm’s supply is 1.25. What quantitywill the firm supply at the new price?
Ans. Given Es = 1.25

Change in price = 20
Proportionate change in Price = 20/10 = 2
![]()
![]()
Proportionate Change in Quantity Supplied = 1.25 X 2 = 2.5
Proportionate change in Quantity Supplied = x/4 = 2.5
x = 2.5 X 4 = 10
Change in quantity = 10
Therefore, new supply at the price of 30 will be = 4 + 10 = 14