
NCERT QUESTIONS AND ANSWERS
1. The unit of correlation coefficient between height in feet and weight in kgs is
(i) kg/feet
(ii) percentage
(iii) non-existent
Ans. (iii) non-existent
2. The range of simple correlation coefficient is
(i) 0 to infinity
(ii) minus one to plus one
(iii) minus infinity to infinity
Ans. (ii) minus one to plus one
3. If rxy is positive the relation between X and Y is of the type
(i) When Y increases X increases
(ii) When Y decreases X increases
(iii) When Y increases X does not change
Ans. (i) when y increases x increases
4. If rxy = 0 the variable X and Y are
(i) linearly related
(ii) not linearly related
(iii) independent
Ans. (ii) not linearly related)
5. Of the following three measures which can measure any type of relationship
(i) Karl Pearson’s coefficient of correlation
(ii) Spearman’s rank correlation
(iii) Scatter diagram
Ans (iii) scatter diagram)
6. If precisely measured data are available the simple correlation coefficient is
(i) more accurate than rank correlation coefficient
(ii) less accurate than rank correlation coefficient
(iii) as accurate as the rank correlation coefficient
Ans. Generally, all the properties of Karl Pearson’s coefficient of correlation are similar to that of the rank correlation coefficient. However, rank correlation coefficient is generally lower or equal to Karl Pearson’s coefficient. The reason for this difference between the two coefficients is because the rank correlation coefficient uses ranks instead of the full set of observations that leads to some loss of information. If the precisely measured data are available, then both the coefficients will be identical.
7. Why is r preferred to covariance as a measure of association?
Ans. Although correlation coefficient is similar to the covariance in a manner that both measure the degree of linear relationship between two variables, but the former is generally preferred to covariance due to the following reasons.
- The value of the correlation coefficient (r) lies between 0 and 1. Symbolically –1 ≤ r≤ +1
- The correlation coefficient is scale free.
8. Can r lie outside the –1 and 1 range depending on the type of data?
Ans. No, the value of r cannot lie outside the range of –1 to 1. If r = – 1, then there exists perfect negative correlation and if r = 1, then there exists perfect positive correlation between the two variables. If at any point of time the calculated value of r is outside this range, then there must be some mistake committed in the correlation.
9. Does correlation imply causation?
Ans. No, correlation does not imply causation. The correlation between the two variables does not imply that one variable causes the other. In other words, cause and effect relationship is not a prerequisite for the correlation. Correlation only measures the degree and intensity of the relationship between the two variables, but surely not the cause and effect relationship between them.
10. When is rank correlation more precise than simple correlation coefficient?
Ans. Rank Correlation method is more precise than simple correlation coefficient when the variables cannot be measured quantitatively. In other words, rank correlation method measures the correlation between the two qualitative variables. These variable attributes are given the ranks on the basis of preferences. For example, selecting the best candidate in a dance competition depends on the ranks and preferences awarded to him/her by the judges. Secondly, the rank correlation method is preferred over the simple correlation coefficient when extreme values are present in the data. In such case using simple correlation coefficient may be misleading
11. Does zero correlation mean independence?
Ans. Correlation measures the linear relationship between the two variables. So, r being 0 implies the absence of linear relationship. But they may be non-linearly related. Hence, if two variables are not correlated, it does not necessarily follow that they are independent.
12. Can simple correlation coefficient measure any type of relationship?
Ans. No, the simple correlation coefficient cannot measure any type of relationship. The simple correlation coefficient can measure only the direction and magnitude of linear relationship between the two variables. It cannot measure non-linear relationship like quadratic, trigonometric, cubic, etc. Therefore, in such cases, the purview of simple correlation coefficient falls short. For example, the simple correlation coefficient may depict that X and Y are not correlated in the equation X= Y2, hence it may be concluded that both the variables are independent, but such conclusion may be wrong.
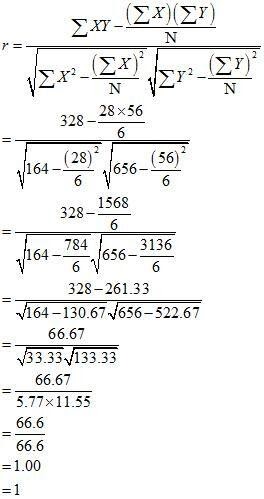
13. Measure the height of your classmates. Ask them the height of their benchmate. Calculate the correlation coefficient of these two variables. Interpret the result.
Ans.
| Height of Classmate
X |
Height of Benchmate
Y |
| 67 | 65 |
| 56 | 66 |
| 65 | 57 |
| 68 | 67 |
| 72 | 68 |
| 72 | 69 |
| 69 | 70 |
| 71 | 72 |
| X | Y | XY | X2 | Y2 |
| 67 | 65 | 4355 | 4489 | 4225 |
| 56 | 66 | 3696 | 3136 | 4356 |
| 65 | 57 | 3705 | 4225 | 3249 |
| 68 | 67 | 4556 | 4624 | 4489 |
| 72 | 68 | 4896 | 5184 | 4624 |
| 72 | 69 | 4968 | 5184 | 4761 |
| 69 | 70 | 4830 | 4761 | 4900 |
| 71 | 72 | 5112 | 5041 | 5184 |
14. List some variables where accurate measurement is difficult.
Ans. The following are the some variables where the accurate measurement is difficult.
- Temperature and number of people falling ill.
- Change in temperature with the height of mountain.
- Low rainfall and agricultural productivity
- High population growth and degree of poverty
- Number of tourists and change in the political atmosphere in India.
15. Interpret the values of r as 1, –1 and 0.
Ans. The value of r being 1 implies that there is a perfect positive correlation between the two variables involved. A high value of r (i.e. close to 1) represents a strong positive linear relationship between the two variables.
If r = –1, then the correlation is perfectly negative. A negative value of r indicates an inverse relation. A low value of r (i.e. close to –1) represents a strong negative linear relationship between the variables. On the other hand, if the value of r = 0, then it implies that the two variables are uncorrelated to each other. But this should not be misunderstood as the variables are independent of each other. The value of r equals zero confirms only the non-existence of any linear relation but the variables may be non-linearly related to each other
16. Why does rank correlation coefficient differ from Pearsonian correlation coefficient
Ans. Generally, all the properties of Karl Pearson’s coefficient of correlation are similar to that of the rank correlation coefficient. However, rank correlation coefficient is generally lower or equal to Karl Pearson’s coefficient. Rank correlation coefficient is generally preferred to measure the correlation between the two qualitative variables. These variable attributes are given the ranks on the basis of preferences. The difference between the two coefficients is due to the fact that the rank correlation coefficient uses ranks instead of the full set of observations that leads to some loss of information. If the precisely measured data are available, then both the coefficients will be identical. Secondly, if extreme values are present in the data, then the rank correlation coefficient is more precise and reliable and consequently its value differs from that of the Karl Pearson’s coefficient
17. Calculate the correlation coefficient between the heights of fathers in inches (X) and their sons (Y)
| X | 65 | 66 | 57 | 67 | 68 | 69 | 70 | 72 |
| Y | 67 | 56 | 65 | 68 | 72 | 72 | 69 | 71 |
ANS.
| X | Y | XY | X2 | Y2 |
| 65 | 67 | 4355 | 4225 | 4489 |
| 66 | 56 | 3696 | 4356 | 3136 |
| 57 | 65 | 3705 | 3249 | 4225 |
| 67 | 68 | 4556 | 4489 | 4624 |
| 68 | 72 | 4896 | 4624 | 5184 |
| 69 | 72 | 4968 | 4761 | 5184 |
| 70 | 69 | 4830 | 4900 | 4761 |
| 72 | 71 | 5112 | 5184 | 5041 |
18. Calculate the correlation coefficient between X and Y and comment on their relationship:
| X | –3 | –2 | –1 | 1 | 2 | 3 |
| Y | 9 | 4 | 1 | 1 | 4 | 9 |
Ans.
| X | Y | XY | X2 | Y2 |
| –3 | 9 | –27 | 9 | 81 |
| –2 | 4 | –8 | 4 | 16 |
| –1 | 1 | –1 | 1 | 1 |
| 1 | 1 | 1 | 1 | 1 |
| 2 | 4 | 8 | 4 | 16 |
| 3 | 9 | 27 | 9 | 81 |

As the value of r is zero, so there is no linear correlation between X and Y
19. Calculate the correlation coefficient between X and Y and comment on their relationship
| X | 1 | 3 | 4 | 5 | 7 | 8 |
| Y | 2 | 6 | 8 | 10 | 14 | 16 |
Ans.
| X | Y | XY | X2 | Y2 |
| 1 | 2 | 2 | 1 | 4 |
| 3 | 6 | 18 | 9 | 36 |
| 4 | 8 | 32 | 16 | 64 |
| 5 | 10 | 50 | 25 | 100 |
| 7 | 14 | 98 | 49 | 196 |
| 8 | 16 | 128 | 64 | 256 |
As the correlation coefficient between the two variables is +1, so the two variables are perfectly positive correlated