NCERT QUESTIONS AND ANSWERS
1.A measure of dispersion is a good supplement to the central value in understanding a frequency distribution. Comment.
Ans. The study of the averages is only one sided distribution story. In order to understand the frequency distribution fully, it is essential to study the variability of the observations. The average measures center of the data whereas the quantum of the variation is measured by the measures of dispersion like range, quartile deviation, mean deviation and Standard Deviation. For example, if a country has very high income group people and very low income group people, then we can say that the country has large income disparity
2.Which measure of dispersion is the best and how?
Ans. Standard Deviation is the best measure of dispersion as it satisfies the most essentials of the good measure of dispersion. The following points make Standard Deviation the best measure of dispersion:
- Most of the statistical theory is based on Standard Deviation. It helps to make comparison between variability of two or more sets of data. Also, Standard Deviation helps in testing the significance of random samples and in regression and correlation analysis.
- It is based on the values of all the observations. In other words, Standard Deviation makes use of every item in a particular distribution.
- Standard Deviation has a precise value and is a well-defined and definite measure of dispersion. That is, it is rigidly defined.
- It is independent of the origin.
- It is widely used measure of dispersion as all data distribution is nearer to the normal distribution.
- It enables algebraic treatment. It has correct mathematical processes in comparison to range, quartile deviation and mean deviation.
3.Some measures of dispersion depend upon the spread of values whereas some calculate the variation of values from a central value. Do you agree?
Ans. Yes, it is true that some measures of dispersion depend upon the spread of values, whereas some calculate the variation of values from the central value. The spread of values is determined by the absolute measures of dispersion like Range, Quartile Mean Deviation, and Standard Deviation. These measures express dispersion in terms of original unit of the series and it cannot be used for the comparison of statistical data having different units
- In a town, 25% of the persons earned more than Rs 45,000 whereas 75% earned more than 18,000. Calculate the absolute and relative values of dispersion.
Ans. Absolute Value of Dispersion
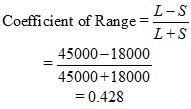
Relative Value of Dispersion
- The yield of wheat and rice per acre for 10 districts of a state is as under:
| District | 1 | 2 | 3 | 4 | 5 | 6 | 7 | 8 | 9 | 10 |
| Wheat | 12 | 10 | 15 | 19 | 21 | 16 | 18 | 9 | 25 | 10 |
| Rice | 22 | 29 | 12 | 23 | 18 | 15 | 12 | 34 | 18 | 12 |
Calculate for each crop,
(i) Range
Ans. Range
- Wheat
Highest value of distribution (H) = 25
Lowest value of distribution (L) = 9
Range = H – L
= 25 – 9
=16
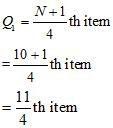
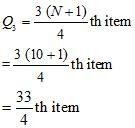
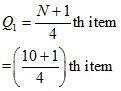
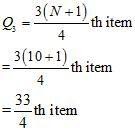
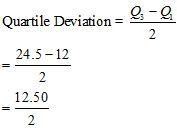
(ii) Q.D.
Ans . Wheat
Arranging the production of wheat in increasing order
9, 10, 10, 12, 15, 16, 18, 19, 21, 25
= 2.75th item
=Size of 2th item + 0.75 (size of 3rd item – size of 2nd item)
= 10 + 0.75 (10 – 10)
= 10 + 0.75 × 0
=10
= 8.25th
=Size of 8th item + 0.25 (size of 9th item – size of 8th item)
= 19 + 0.25 (21 – 19)
= 19 + 0.25 × 2
= 19 + 0.50 = 19.50
= 4.75
- Rice
Arranging the data of production of rice
12, 12, 12, 15, 18, 18, 22, 23, 29, 34
= 2.75th item
= size of 2nd item + 0.75 (size of 3rditem – size of 2nd item)
= 12 + 0 .75 (12 – 12)
= 12 + 0.75 × 0
= 12
= 8.25th item
= Size of 8th item + 0.25 (size of 9th item – size of 8th item)
= 23 + 0.25 (29 – 23)
= 23 + 0.25 × 6
= 23 + 1.5
= 24.5
(iii) Mean Deviation about Mean
Ans. Mean Deviation about Mean
- Wheat
| Wheat Production
x |
|
| 9 | 6 |
| 10 | 5 |
| 10 | 5 |
| 12 | 3 |
| 15 | 0 |
| 16 | 1 |
| 18 | 3 |
| 19 | 4 |
| 21 | 6 |
| 25 | 10 |
- Rice
| Rice Production
x |
|
| 12 | 6 |
| 12 | 6 |
| 12 | 6 |
| 15 | 3 |
| 18 | 0 |
| 18 | 0 |
| 22 | 4 |
| 23 | 5 |
| 29 | 11 |
| 34 | 16 |
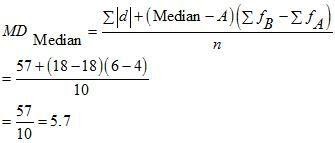
(iv) Mean Deviation about median
Ans. Mean Deviation about Median
- Wheat
| Production of Wheat
x |
|
| 09 | 6 |
| 10 | 5 |
| 10 | 5 |
| 12 | 3 |
| 15 | 0 |
| 16 | 1 |
| 18 | 3 |
| 19 | 4 |
| 21 | 6 |
| 25 | 10 |
- Rice
| Production of rice | d = X–18 |
| 12 | 6 |
| 12 | 6 |
| 12 | 6 |
| 15 | 3 |
| 0 | |
| 18 | 0 |
| 22 | 4 |
| 23 | 5 |
| 29 | 11 |
| 34 | 16 |
Since n is even
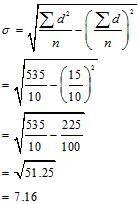
(v) Standard Deviation
Ans. Standard Deviation
- Wheat
| Reduction of Wheat
x |
Ax = 15
d= x – Ax |
d2 |
| 9 | –6 | 36 |
| 10 | –5 | 25 |
| 10 | –5 | 25 |
| 12 | –3 | 9 |
| 15 | 0 | 0 |
| 16 | 1 | 1 |
| 18 | 3 | 9 |
| 19 | 4 | 16 |
| 21 | 6 | 36 |
| 25 | 10 | 100 |
- Rice
| Production of rice
x |
Ax = 18
d = x – A x |
d2 |
| 12 | –6 | 36 |
| 12 | –6 | 36 |
| 12 | –6 | 36 |
| 15 | –3 | 9 |
| 18 | 0 | 0 |
| 22 | 4 | 16 |
| 23 | 5 | 25 |
| 29 | 11 | 121 |
| 34 | 16 | 256 |
(vi) Which crop has great variation?
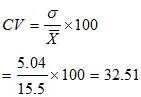
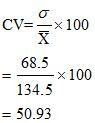
Ans Coefficient of Variation
- Wheat
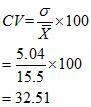
- Rice
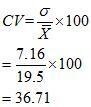
Rice crop has greater variation as the coefficient of variation is higher for rice as compared to that of wheat.
(vii) Compare the value of different measures for each crop.
Ans. Rice crop has higher Range, Quartile Deviation, Mean Deviation about mean, Mean Deviation about median, Standard Deviation and Coefficient of Variation.
- In the previous question, calculate the relative measures of variation and indicate the value which, in your opinion, is more reliable.
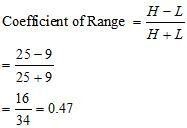
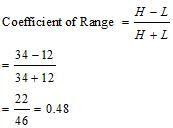
Ans. Coefficient of Range
- a) Wheat
- b) Rice
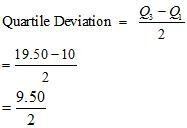
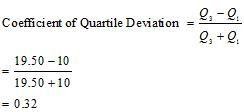
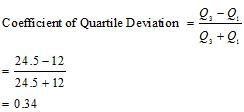
(ii) Coefficient of Quartile Deviation
- a) Wheat
- b) Rice
Q1 = 12, Q3 = 24.5
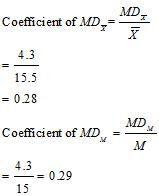
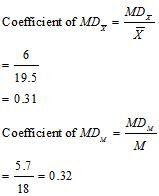
(iii) Coefficient of Mean Deviation from mean
- a) Wheat
- b) Rice
(iv) Coefficient of Variation
- a) Wheat
- b) Rice
- The coefficient of variation is more reliable than all other measures
A batsman is to be selected for a cricket team. The choice is between X and Y on the basis of their scores in five previous tests which are:
| X | 25 | 85 | 40 | 80 | 120 |
| Y | 50 | 70 | 65 | 45 | 80 |
Which batsman should be selected if we want,
(i) a higher run getter, or
(ii) a more reliable batsman in the team?
Ans.
| Batsman X | |||
| X | X – = x
X – 70 |
x2 | |
| 25 | – 45 | 2025 | |
| 85 | + 15 | 225 | |
| – 30 | 900 | ||
| 80 | 10 | 100 | |
| 120 | 50 | 2500 | |
| Batsman Y | |||
| Y | y2 | ||
| 50 | – 12 | 144 | |
| 70 | 8 | 64 | |
| 65 | 3 | 9 | |
| 45 | – 17 | 289 | |
| 80 | 18 | 324 | |
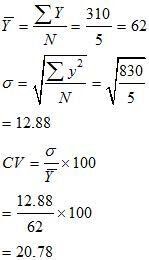
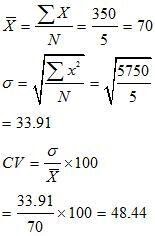
(i) Average of Batsman X is higher than that of Batsman Y, so he should be selected if we want to score higher run.
(ii) The Batsman X is more reliable than Batsman Y. This is because the coefficient of variation of Batsman X is higher than that of Batsman Y.
- To check the quality of two brands of light bulbs, their life in burning hours was estimated as under for 100 bulbs of each brand.
| Life | No. of bulbs | ||
| (in hrs) | Brand A | Brand B | |
| 0 – 50 | 15 | 2 | |
| 50 – 100 | 20 | 8 | |
| 100 – 150 | 18 | 60 | |
| 150 – 200 | 25 | 25 | |
| 200 – 250 | 22 | 5 | |
| 100 | 100 | ||
(i) Which brand gives higher life?
(ii) Which brand is more dependable?
| For Brand A | ||||||||
| Life
(in hours) |
No. of bulbs | M | A = 125 | d‘2 | fd‘ | fd‘2 | ||
| f | x | X – A = d | ||||||
| 0 – 50 | 15 | 25 | – 100 | – 2 | 4 | – 30 | 60 | |
| 50 – 100 | 20 | 75 | – 50 | – 1 | 1 | – 20 | 20 | |
| 100 – 150 | 18 | 125 | 0 | 0 | 0 | 0 | 0 | |
| 150 – 200 | 25 | 175 | 50 | 1 | 1 | 25 | 25 | |
| 200 – 250 | 22 | 225 | 100 | 2 | 4 | 44 | 88 | |
| For Brand B
|
||||||||
| Life (in hrs) | No. of bulbs(f) | Mid valuem | A = 125 | d’2 | fd’ | fd’2 | ||
| 0 – 50 | 2 | 25 | – 100 | – 2 | 4 | – 4 | 8 | |
| 50 – 100 | 8 | 75 | – 50 | – 1 | 1 | – 8 | 8 | |
| 100 – 150 | 60 | 125 | 0 | 0 | 0 | 0 | 0 | |
| 150 – 200 | 25 | 175 | 50 | 1 | 1 | 25 | 25 | |
| 200 – 250 | 5 | 225 | 100 | 2 | 4 | 10 | 20 | |
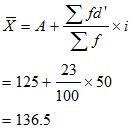
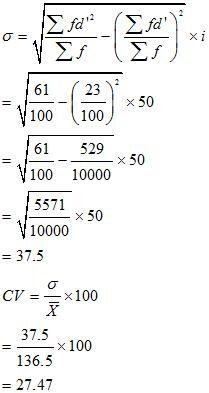
(i) The average life of bulb of Brand B has comparatively higher life than the bulb of Brand A.
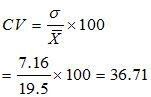
(ii) The bulbs of Brand B is more dependable as CV of Brand B is lesser than CV of Brand A.
- Average daily wage of 50 workers of a factory was Rs 200 with a Standard Deviation of Rs 40. Each worker is given a raise of Rs 20. What is the new average daily wage and Standard Deviation? Have the wages become more or less uniform?
Ans.
N = 50
= 200
s = 40
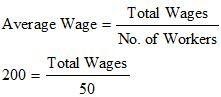
So, Total Wages = 200 × 50
= Rs 10,000
Now, increased wage rate = Rs 20
Total raise = 50 × 20 = Rs 1,000
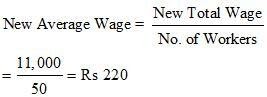
Total Wage after raise = 10,000 + 1,000
=Rs 11,000
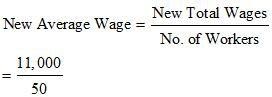
= Rs 220
Initial Standard Deviation = Rs 40
So, New Standard Deviation = Rs 40 + Rs 20
= Rs 60
Note: New Standard Deviation will rise by the same amount as the wage of each worker has increased
- If in the previous question, each worker is given a hike of 10% in wages, how are the Mean and Standard Deviation values affected?
Ans.
Average wage = Rs 200
Hike in wages = 10% of Rs 200
![]()
= Rs 20
Individual raise given to each worker = Rs 20
Total raise in wage = 50 × 20 = Rs 1,000
New Total Wage = Rs 10,000 + Rs 1000
= Rs 11,000
Initial Standard Deviation = Rs 40
So, New Standard Deviation = Rs 40 + 20
= Rs 60
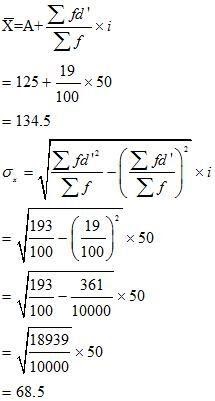
- Calculate the Mean Deviation using mean and Standard Deviation for the following distribution.
| Classes | Frequencies |
| 20 – 40 | 3 |
| 40 – 80 | 6 |
| 80 – 100 | 20 |
| 100 – 120 | 12 |
| 120 – 140 | 9 |
| Total | 50 |
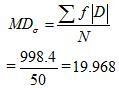
Ans.
| Classes | Frequency | m | A = 90
d = X – A |
fd’ | d’2 | fd’2 | |||
| 20 – 40 | 3 | 30 | – 60 | 60 | 180 | – 6 | – 18 | 36 | 108 |
| 40 – 80 | 6 | 60 | – 30 | 30 | 180 | – 3 | – 18 | 9 | 54 |
| 80 – 100 | 20 | 90 | 0 | 0 | 0 | 0 | 0 | 0 | 0 |
| 100 – 120 | 12 | 110 | 20 | 20 | 240 | 2 | 24 | 4 | 48 |
| 120 – 140 | 9 | 130 | 40 | 40 | 360 | 4 | 36 | 16 | 144 |
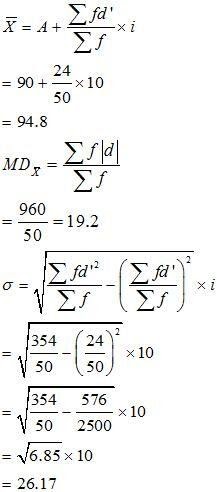
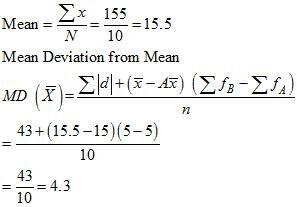
Mean Deviation from mean
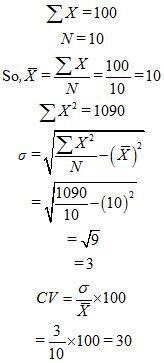
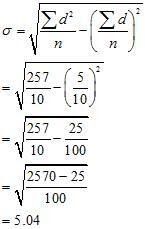
12.The sum of 10 values is 100 and the sum of their squares is 1090. Find out the Coefficient of Variation.
Ans.